
-
Laboratory Activities
- Modified Whittaker Plot
- Intensive Modified Whittaker Plot
- Nested Pixel Plot
- P-Plot
- C-Plot
- Beyond NAWMA Circle
Tips
GPS
Invasive Species Exercises: Modified Whittaker Plot
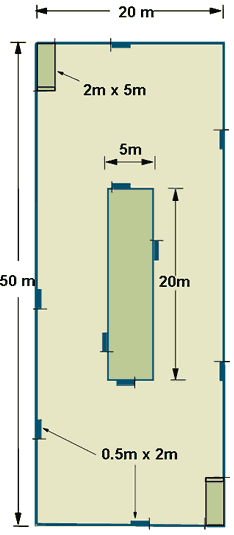
The standard Modified Whittaker Plot is used for monitoring plants at multiple scales - 1 square meter, 10 square meters, 100 square meters, and 1,000 square meters - all within one plot.
The 1,000 square meter plot is the main unit of analysis, with the smaller sections throughout the plot as subplots, as described below.
Setting up the Standard Modified Whittaker Plot
Equipment:
- Two 100-meter tapes
- One 50-meter tape
- Eight Ground stakes
- ~25 Marking flags
- Meter stick
- One 0.5 by 2-meter subplot frame
- One 2 by 5-meter subplot frame
- Compass
- 2.5-centimeter diameter soil increment core (if you are doing soil analysis too)
- Plastic bags (for soil samples)
- GPS unit
- Reference materials (dichotomous floristic keys, etc)
- Materials to collect unknowns
- Look around the area and determine the environmental gradient in order to position the long side (50 m) of the 1,000 square meters plot (K) parallel to the gradient. (The goal is to cover the most variation possible.)
- Using two 100 m tapes (1 and 2), lay out the main plot (K) 20 x 50 m rectangle. Anchor tape ends at the starting point (right bottom corner, label 0,0). Using a compass to shoot a 90 degree angle, run tapes out following the arrows. Anchor the 20 m and 50 m corners.
- Flag 7.5, 12.5, 35, and 55 m marks of tape (1), and 15, 35, 57.5, and 62.5 m marks of tape (2).
- Using a 50 m tape (3) and the flags marked at 7.5 m and 35 m of tape (1) and 15 m of tape (2), determine and anchor the starting point (0, 50 m) of subplot C (inner rectangle). Moving clockwise, lay out this subplot.
- Take a magnetic azimuth (bearing) of tape (1) and tape (2) at the (0, 0) corner. Write it down in your field notebook with the plot name, site description and UTM coordinates from the GPS unit. (Or use the site description sheet.)
- Starting from the (0,0) point of K, walk to the 8 m mark of tape (1) and place the 0.5 x 2 m subplot frame along the inside boundary of the K plot. Record all the species present within the subplot. Measure their average heights and determine (estimate) their percent cover. Flag unknown species as you encounter them, and make their labels (numbers) even if you aren’t collecting them right away.
- When finished at this location, pick up the subplot frame and moving clockwise, repeat step 6 until all ten 1-square meters subplots are completed. There are six subplots around the inside of K plot, and four subplots around the outside of the C subplot.
- Using flags and the subplot frame, set up subplots A and B. (Subplots A and B can be sampled in sequence with the 1-square meters subplots). Record the species present in the A, B, and C subplots.
- Walk through the entire K (1,000-square meters) plot and record any species new to the plot.
- Label and collect unknowns.
Sampling Methods:
A Modified Whittaker Plot should be created at every area for which you would like to monitor invasive species.
The plants within the plot should be sampled at peak phenology of the majority of species.
In the ten 1-square meter subplots, record the absolute foliar cover (%) and height (cm), as well as species of plant. If cover in a subplot is less than 1%, it should be recorded as 0.5% cover.
Recordings of percent cover for bare ground, rock, duff (attached dead plant material), litter (detached dead plant material), water, and dung are preferred, but can be modified to fit your purposes.
Additional plant species are recorded for each subplot and the remaining unsampled area of the large plot.
You may record the location of your plot with a GPS reading that can be imported directly into a Geographic Information System (GIS) database for NIISS.
References:
-
Stohlgren, T.J., Falkner, M.B., and L.D. Schell. 1995. A Modified-Whittaker nested vegetation sampling method. Vegetation 117:113-121.
National Institute of Insvasive Species Science