
Introduction
Location Map
Base Map
Database Schema
Conventions
GIS Analyses
Flowchart
GIS Concepts
Results
Conclusion
References
![]()
GIS Analyses
The first step was to download data for both current and predicted future climate conditions for the country of Ethiopia. Since no Ethiopia-specific data were available, we downloaded global monthly data for precipitation (prec), maximum temperature (tmax), and minimum temperature (tmin). The source for the data was the website www.worldclim.org. The Worldclim website is actually a clearing house for global climate model outputs. We utilized the CCCMA model, developed by the Canadian Centre for Climate Modelling and Analysis. The data selected were in three forms: 1) current conditions, 2) year 2050 predictions for warming scenario A2a, and 3) year 2050 predictions for scenario B2A. The raster data were acquired at the highest possible resolution (30 second x 30 second grid). Data were unprojected, in datum WGS 84. No transformations or reprojections were conducted.

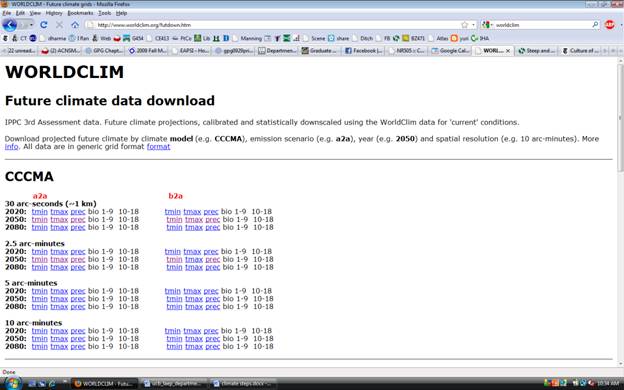
We therefore had to download 9 sets of data. Each was in zipped format. Each contained a raster layer for each of the 12 months. We therefore had 108 layers of monthly data.
Current prec
Current tmin
Current tmax
A2a prec
A2a tmin
A2a tmax
B2a prec
B2a tmin
B2a tmax
Since each zipped file was approximately 1 GB, the downloading took several hours on my home internet connection which is quite slow. The next step was to unzip the files. Each unzipped file was approximately 18 GB in size, requiring a large amount of storage space. Because storage space was limited, we needed to unzipp each file one at a time and then clip it to the extent of Ethiopia, therefore reducing the file size to approximately 5 MB for each of the data sets.
Clipping Data
The analysis tool “Clip” in ArcMap was used to limit the global raster data to within the boundary of the country of Ethiopia. This procedure was done for two reasons. First, that because our analysis is only concerned with Ethiopia, the clip makes the results more easily understood. Second, because the files were so large, the clip significantly reduced the amount of necessary storage space. Thus, by clipping at the beginning of the GIS analysis, all later tasks could be accomplished more rapidly by ArcMap.

The “Input Feature” was the global raster data.
The “Clip Feature” was a shapefile of the boundary of Ethiopia.
The “Output Feature Class” was the name of the new layer (restricted to Ethiopian Boundaries)
Data Analysis
After all data files had been “clipped” to the boundary of Ethiopia, the files were ready to be opened in Arc Map for analysis.
PART ONE- DEFINING RASTER DATA FILE PROJECTION
Prior to analysis of raster data files using Arc Map, the projection of each data file had to be confirmed using Arc Catalogue. Although the original downloaded data files were projected in the Geographic Coordinate System: WGS 1984, when these files were imported into Arc Catalogue and Arc Map the spatial projection was determined by the software to be “unknown.”
Therefore, the Arc Toolbox within Arc Catalogue was used to define the projection of the files.

PART TWO- CREATING ANNUAL AVERAGE LAYERS FROM MONTHLY DATA
Current Annual Precipitation
To create a data layer displaying Ethiopia’s current annual precipitation (sum total of yearly precipitation in millimeters), a new map file was opened in ArcMap and the following 12 files were added to a data frame entitled “Cur_Prec”:
Prec_1_Clip.img Prec_7_Clip.img
Prec_2_Clip.img Prec_8_Clip.img
Prec_3_Clip.img Prec_9_Clip.img
Prec_4_Clip.img Prec_10_Clip.img
Prec_5_Clip.img Prec_11_Clip.img
Prec_6_Clip.img Prec_12_Clip.img
STEP 1

These added raster files display monthly current precipitation (with the file name Prec_1_Clip.img describing precipitation for the first month of January, and so on). To create a map that displays the annual precipitation, the cell statistics function in Arc Map was used.
STEP 2

STEP 3

STEP 4

STEP 5

STEP 6 
STEP 7 

STEP 9

The final result is a layer file displaying current annual precipitation in millimeters.

Predicted 2050 Annual Precipitation- CCCMa A2a & B2a Scenarios
To create data layers displaying the predicted year 2050 average annual precipitation in millimeters by the CCCma global climate model under the A2a and B2a emissions scenarios, the following 12 files were added to a data frame entitled “A2a_Prec”:
wc_30s_CCCMA_A2a_2050_prec_1 _clip through wc_30s_CCCMA_A2a_2050_prec_12_clip
And the following 12 files were added to a data frame entitled “B2a_Prec”:
wc_30s_CCCMA_B2a_2050_prec_1 _clip through wc_30s_CCCMA_B2a_2050_prec_12_clip
Steps 1-9 above were followed to create a layer file displaying predicted year 2050 annual precipitation in millimeters by the CCCma global climate model under the A2a emissions scenario.

And Steps 1-9 above were followed to create a layer file displaying predicted year 2050 annual precipitation in millimeters by the CCCma global climate model under the B2a emissions scenario.

Current Average Annual Temperature (Tmax)
A data layer displaying average annual Tmax was created in a similar way to the precipitation maps discussed above with a few exceptions.
First data files prec_1 _clip through prec_12_clip were added to Arc Map.
In Step 5, the mean of the 12 files was calculated using the Raster Calculator.

STEP 5B

STEP 6B

After these Step 5B, a new field was created under the attribute file for the cur_avg_ann_Tmax layer

This additional step was performed to create a new column that will display temperature with one decimal place. Note: all original downloaded data files for the temperature variable display temperature in values of degrees Celsius times 10 (therefore, 10.2 degrees Celsius appears as 102 in the data table)

After these additional steps, the previously discussed Steps 8-9 (covered above in discussion of Precipitation) were followed to create a data layer displaying average annual tmax in 3.0 degree Celsius intervals.
These additional steps were also performed to create data layers displaying the predicted year 2050 average annual tmax in degrees Celsius by the CCCma global climate model under the A2a and B2a emissions scenarios.
The following 12 files were added to a data frame entitled “A2a_Tmax”:
wc_30s_CCCMA_A2a_2050_tmax_1 _clip through wc_30s_CCCMA_A2a_2050_prec_12_clip
to create the following data layer:

And the following 12 files were added to a data frame entitled “B2a_Tmax”:
wc_30s_CCCMA_B2a_2050_tmax_1 _clip through wc_30s_CCCMA_B2a_2050_prec_12_clip
to create the following data layer:

PART THREE- CREATING A LAYER DISPLAYING THE VARIANCE IN 2050 PREDICTED VALUES COMPARED TO CURRENT VALUES.
After all the layer files have been created for both current and predicted precipitation and Tmax values, an additional analysis was performed to calculate the variance or difference the in the predicted values from the current values.
Variance in Precipitation Values
STEP 1 
STEP 2

STEP 3


STEP 5

The end result is a layer displaying the variance in CCCma predicted A2a scenario 2050 annual precipitation values compared to current annual precipitation values.

Steps 1-5 were repeated for B2a precipitation and A2a/B2a Tmax and the following data layers were produced.
CCCma predicted B2a scenario 2050 average annual precipitation minus current average annual precipitation values.

CCCma predicted A2a scenario 2050 average annual tmax minus current average annual tmax values.

CCCma predicted B2a scenario 2050 average annual tmax minus current average annual tmax values.

PART FOUR- DISPLAYING THE PREDICTED 2050 VARIANCE VALUES FOR AN ETHIOPIAN TOWN OR VILLAGE.
In Parts 1-3, a raster analysis performed for both precipitation and Tmax to display variance values for the entire country of Ethiopia. However, in order to assist Ethiopian farmer and local communities, individual villages or towns should be displayed on the variance data layers to display the impact of climate change by 2050.
To do this, the shapefile: eth_towns was added to Arc Map from the Ethiopian data set located at Qdrive\nr505\Ethiopian_Data_2009\Towns_Roads\eth_towns.
STEP ONE

STEP TWO

STEP THREE

STEP FOUR

STEP FIVE

STEP SIX


Lastly, other Ethiopian towns and villages could be selected for in STEP FOUR to display precipitation and Tmax 2050 variance values. This would allow Ethiopian farmers to easily predict gains/losses of millimeters of precipitation and degrees Celsius of maximum temperature for their community by year 2050 under the two greenhouse gas emission scenarios.