Introduction
Location Map
Base Map
Database Schema
Conventions
GIS Analyses
Flowchart
GIS Concepts
Results
Conclusion
References
Results
Population Growth
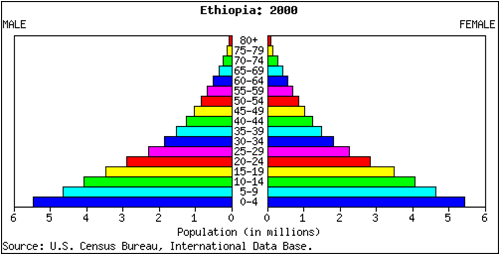
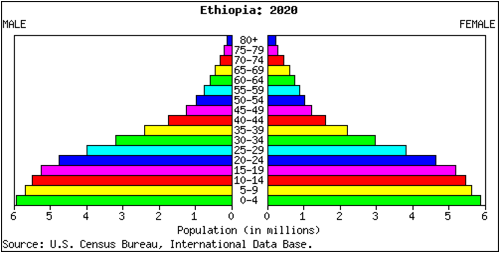
Population pyramids (above) illustrate Ethiopia’s current and projected population growth. With a relatively large proportion (46%) of the population under 14 years of age, Ethiopia faces many challenges with regard to natural resource consumption. The current and future consumption of forest products will continue to increase in and around Bale Mountains National Park if a management plan is not adopted.
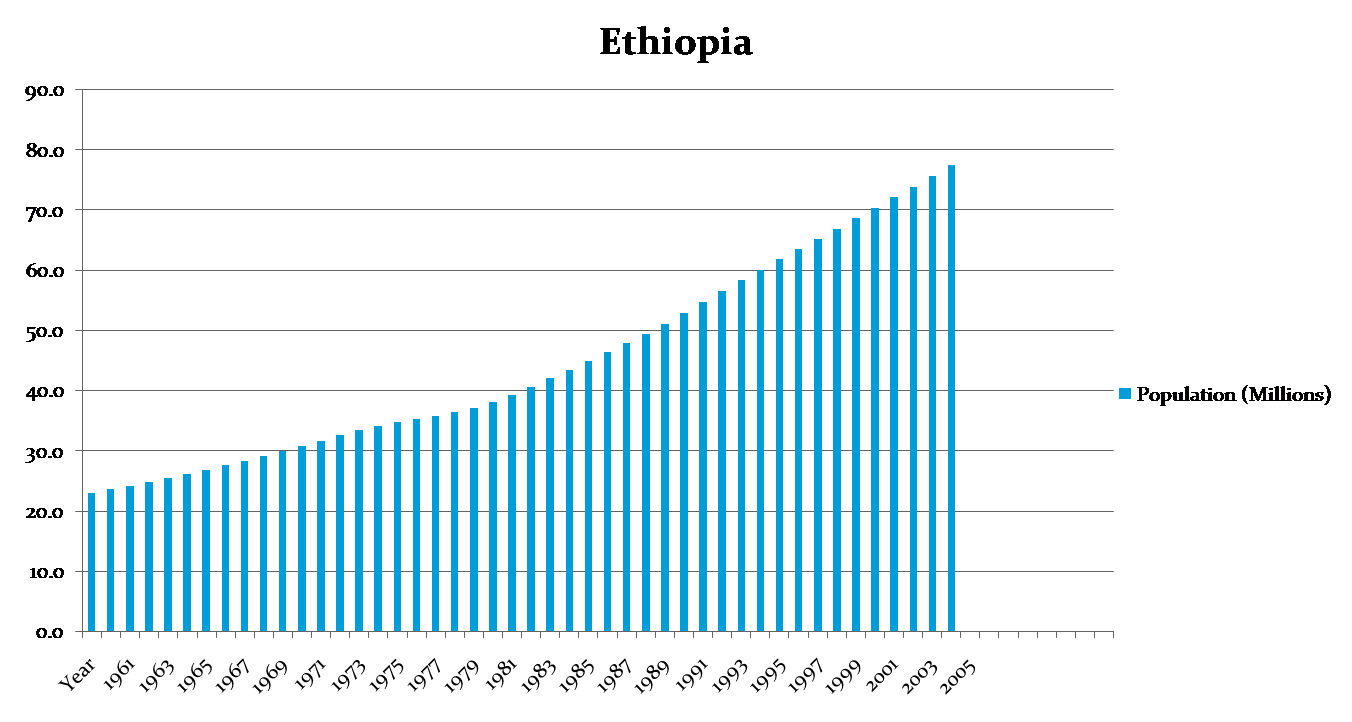
The graph below illustrates population increase throughout the 20th Century, accelerating in the early 1980's and continuing through 2005.
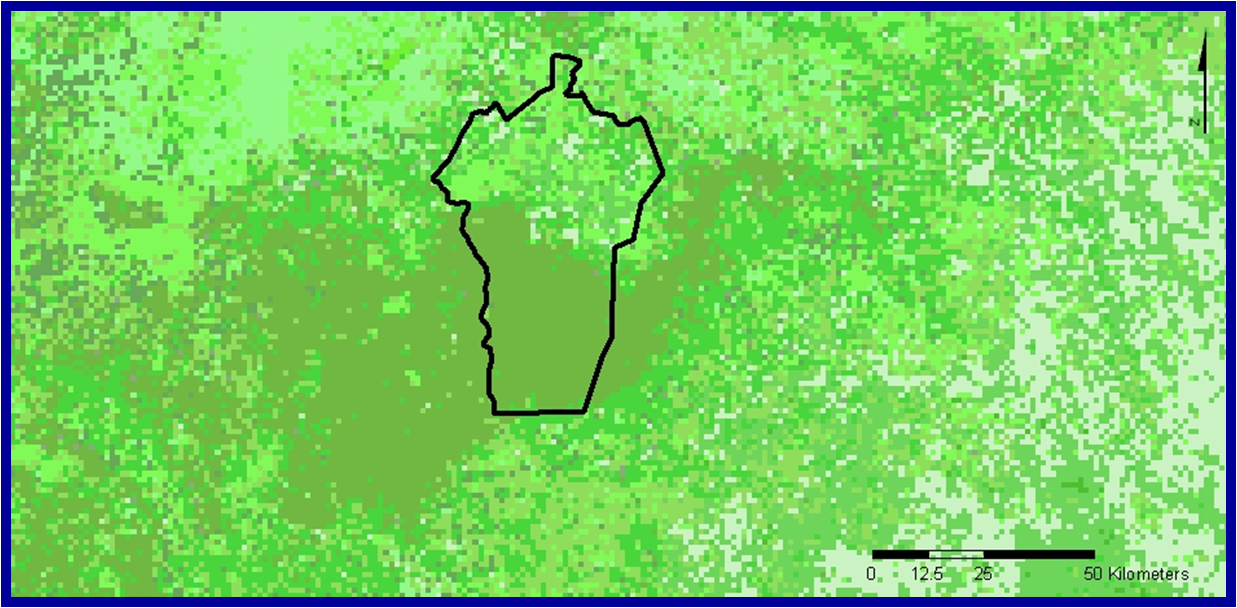
2001 Study Area
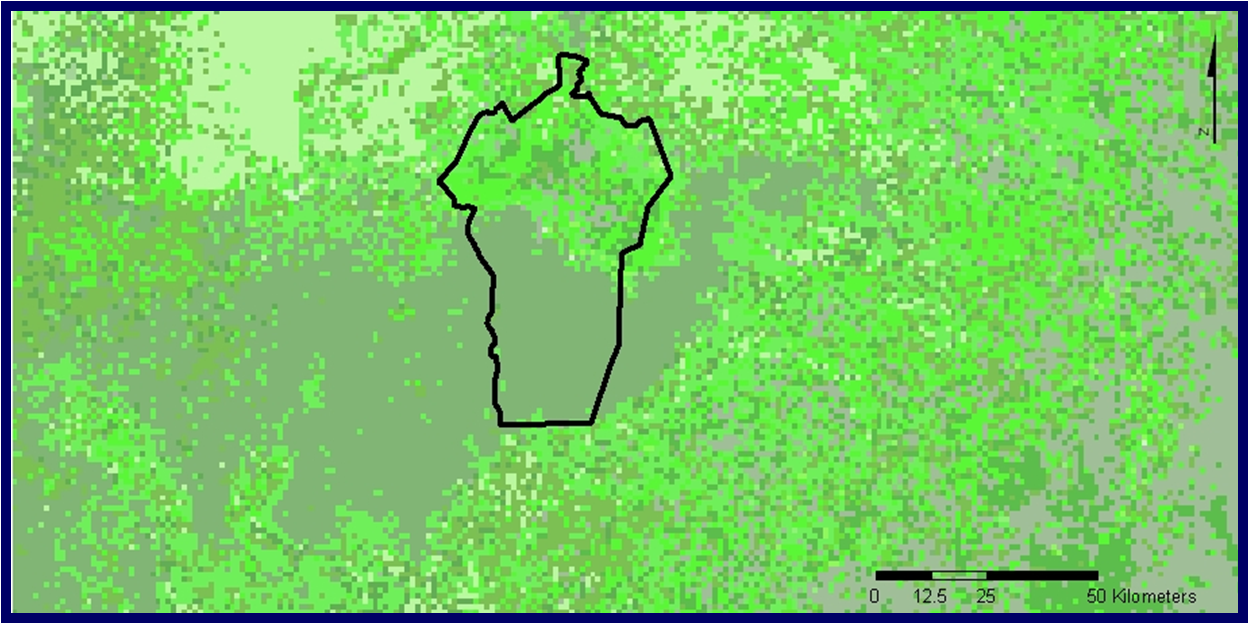
Comparing the entire study area, 7 of 17 categories indicated net losses, with Woody savannahs, Mixed forests and Deciduous broadleaf forests showing the most significant decline. Croplands, Grasslands, Barren or Sparsely Vegetated Areas all showed net gains. Wetlands also showed a net gain, while Urban/Built up areas showed no change.
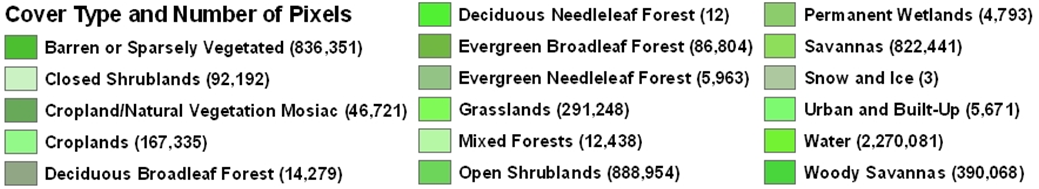
2004 Study Area
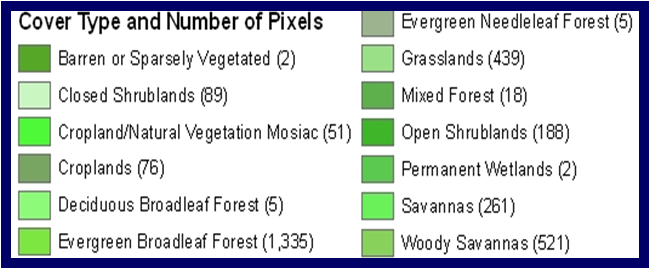
2001 Bale Mountains National Park
As You Can See Below, The 13 Categories that made up the MODIS Land Cover Dataset for Bale Mountains National Park. Evergreen Broadleaf Forest (1,335), Woody Savannas (521), and Grasslands (439) Made up a Majority of the Pixel Values. 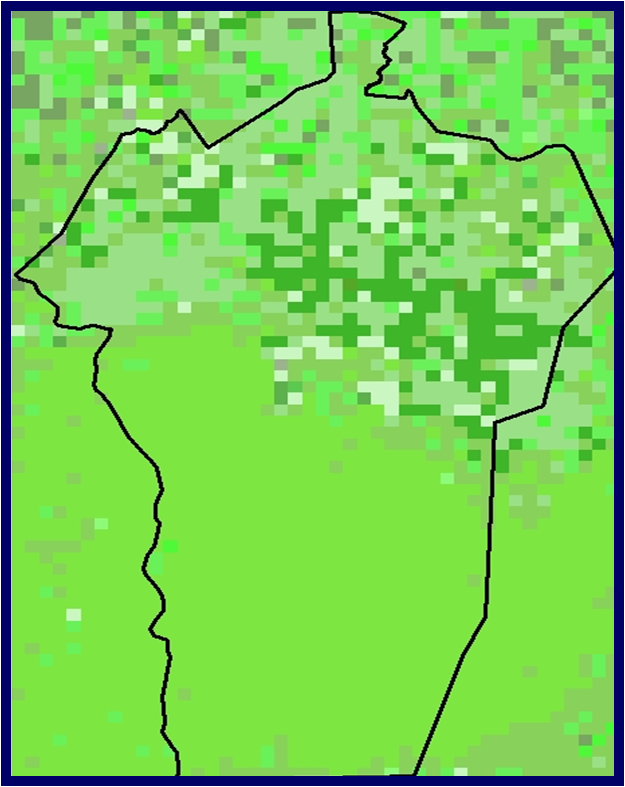
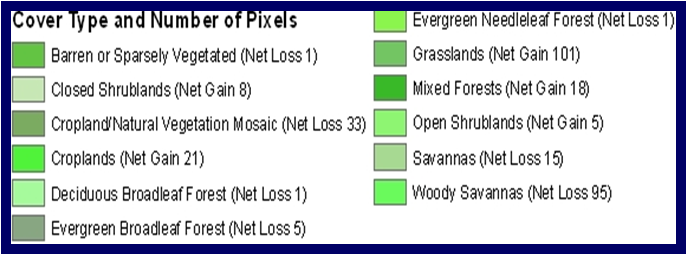
2004 Bale Mountains National Park
As You Can See Below, 7 of the 12 Categories experienced a Net Loss of 1 or More.
Woody Savannas and Cropland/Natural Vegetation Mosaic had the greatest Net Loss with 95 and 33, Respectively.Permanent Wetlands was not in Land Cover 2004.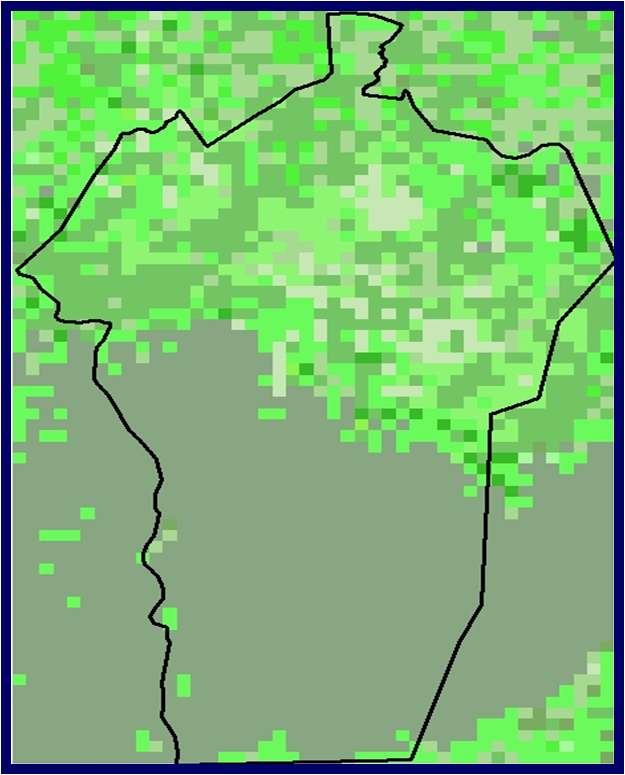
All maps projected: WGS_1984_UTM_Zone37N
Source: MODIS