Introduction
Location Map
Base Map
Database Schema
Conventions
GIS Analyses
Flowchart
GIS Concepts
Results
Conclusion
References

Database Schema
The data used for analysis and results from analysis were organized in a personal geodatabase.
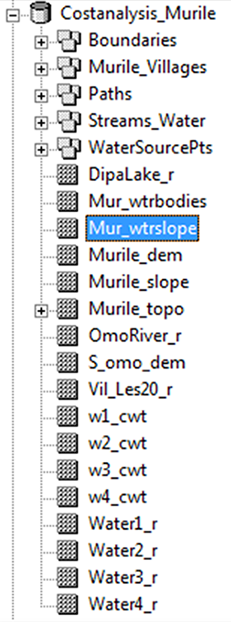
The personal geodatabase contains feature datasets (three squares on top of one another), which organizes the features class (vector data), in addition to raster datasets.
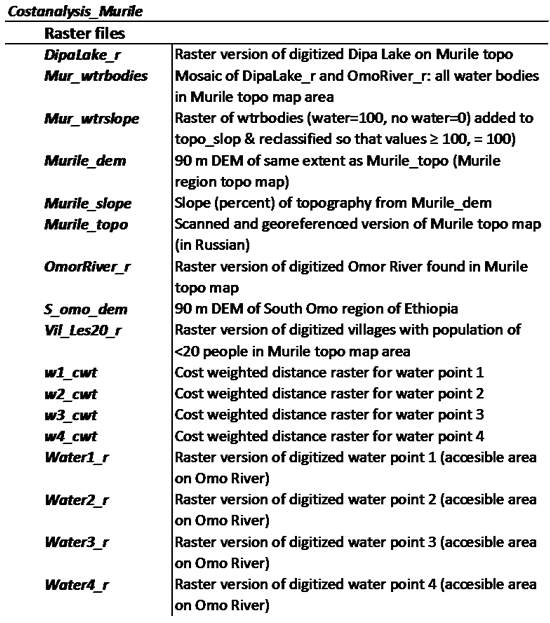
The raster files shown above are explained in the table below. Naming conventions for rasters are restricted to 13 characters but must still explain what it represents. If the raster ecompassed the whole Murile topographic map region, 'Murile' or 'Mur' was kept in the file name. The other extent for a raster was that of the South Omo region, which is listed as 'S_omo.' The '_r' suffix denotes that this is a raster file, which distinguishes it from feature class (vector) from which the file was rasterized. The 'Water1_r' to 'Water4_r' files are those that represent the 4 river access points. For other files, these were abbreviated to 'w1' to 'w4.'
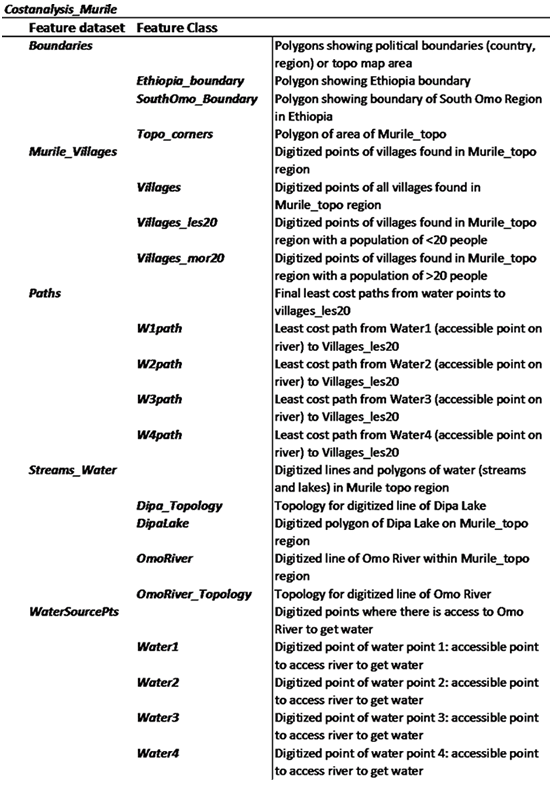
The feature classes, which are points, lines or polygons, are contained within the feature datasets, and the organization is shown below.
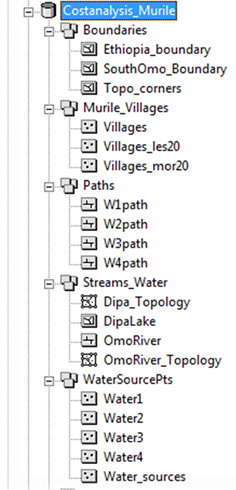
Feature datasets were named according to their general contents. Naming conventions for the feature classes should be failry self-explanatory, and feature class descriptions can be found in the table below. The water source points are grouped together in one point file as 'Water_sources,' and are also in individual files, named 'Water1' through 'Water4.' The final results of our analysis are found in the 'Paths' feature dataset, containing four feature classes. Each feature class shows the paths from a water source point: W1-W4 to all the villages with less than 20 residents (Villages_les20).