Introduction
Location Map
Base Map
Database Schema
Conventions
GIS Analyses
Flowchart
GIS Concepts
Results
Conclusion
References
Conclusion
Our objectives for this project were threefold: first, to develop a protocol to prepare spatial data for analysis in Biomapper using ArcGIS; second, to develop habitat suitability models for Ethiopian antelope species; and lastly, to comment on the models we developed. A brief discussion of each of these objectives follows.
File Preparation Protocol in ArcGIS for Biomapper
Preparing files for analysis in Biomapper “…can be very time consuming…75-90% of time devoted to a project” (Biomapper User Manual). Further, the user manual provides little instructive information on how files acceptable to Biomapper can be created. We have created such a protocol using ArcGIS and believe that the steps we identified may enable other users of Biomapper to process input files in an efficient manner. Clearly described steps are given in text and with relevant screen captures.
Species Distribution Models
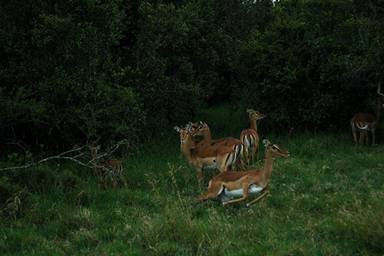
Biomapper allows spatially-explicit statistical modeling of species distributions based on presence-only data. Clearly, such an approach is advantageous because it eliminates the need for species absence data, which is often problematic. Another strength of Biomapper is that it integrates the concept of the ecological niche in the algorithms it uses to factor in the principle that fitness and habitat suitability decrease to either side of an optimum (Hirzel et al. 2002). In this project, we have used GIS and statistical tools to develop habitat suitability maps and models for Ethiopian antelopes. Our models, based on species presence data (P. Evangelista, unpublished data) and 37 environmental layers (bioclimatic, topographical and vegetative), delineated suitable habitats for each species. Typically, 3-4 ordination factors explained marginality and specialization, and “bio14”, “precip10”, “slope”, “npp”, “treecover”, “northness”, “bio4” and “bio15” were important predictor variables for at least five of the six antelope species.
Biomapper did a reasonable job of explaining variation in the models of species distribution for the six Ethiopian antelope species using the ecogeographic variables that were selected as predictor layers. However the explanation of variation would be improved with the selection of even more appropriate predictor variables were they available. For example, data layers on the density of human populations, the distance to perennial and temporary water sources, the distance to roads and the area of and distance to protected areas would have been informative.
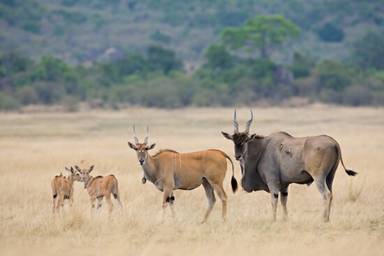
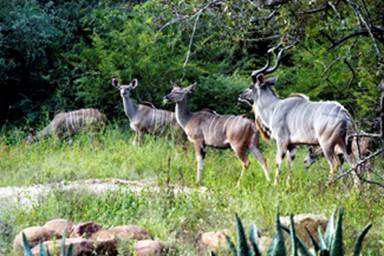
Menelik's Bushbuck had the greatest marginality of habitat conditions, whereas Greater Kudu had the least. Having greater marginality means that suitable habitat conditions for the species have broader availability. Common Eland was the most specialized in niche space, whereas Common Bushbuck was the least. Being more specialized means that the ecological niche of a species is more narrowly defined.
The ecological niche factor analysis demonstrated that the suitable habitat conditions (or species distribution) deviated from the available habitat conditions (or global distribution) differently for the six Ethiopian antelope species. Greater Kudu and Mountain Nyala represented opposite extremes, with suitable habitat conditions of Greater Kudu overlapping broadly and Mountain Nyala overlapping narrowly with available habitat conditions in Ethiopia. The other four antelope species showed intermediate overlap between suitable and available habitat conditions.
The predictive power of the species distribution models was relatively high but the models also had relatively high variability. There are many possible explanations for this variable predictive power. For example, individuals of Common Eland were present only in the southwestern area of Ethiopia, which decreased the variability in values of each predictor variable and probably produced a more confident predictive power. However, much the opposite, individuals of Greater Kudu were present over most of Ethiopia, which increased the range in values of each predictor variable and likely generated a less confident predictive power.
Limitations and Potential
These species distribution models are undoubtedly far more informative than simple range or distribution maps. However, the habitat suitability maps and models presented here can probably be improved substantially for them to effectively help implement conservation strategies or inform policy related to the management of land and wildlife. Broadly, the models suggest that all six antelope species can potentially occupy wider areas than reflected by the data points available to us. While the accuracy of these models can ultimately only be verified by field validation and expert knowledge, we ran a statistical validation for our models, based on the Boyce index (Hirzel et al. 2006), and determined that accuracy ranged between 78% (Menelik’s Bushbuck) and 14% (Common Bushbuck).
The low accuracy values can be attributed to a number of factors. The ecogeographic variables used in the analysis are probably not an ideal set for large herbivores. A large proportion of the layers included in the analysis were bioclimatic or precipitation variables. While these will certainly influence antelope habitats by affecting plant productivity and water availability, it is hard to interpret how exactly they contribute to habitat suitability for a given species. Although correlated variables were discarded before analysis, based on pair-wise correlations, there is a degree of subjectivity in this process when deciding which of two correlated variables is to be dropped. Typically, variables considered less informative to management or less influential on habitat selection by a species are discarded from the analysis (Traill and Bigalke 2006).
Reclassification of land cover posed further problems because the weights assigned to each land cover class were based on the number of species presence points in each class (or an educated guess of land cover classes that are likely to influence a given species). Such decisions may be flawed because the distribution of species locations may merely be an artifact of sampling and not a true reflection of animal abundance or habitat selection. Yet another limitation lies in the fact that apart from X,Y coordinates, no further information on species presence was available. Data such as date and group size and population age structure may allow users to partition data and create more ecologically meaningful models.
Other limitations arise from the algorithms used in Biomapper. Variables included in each factor may not always be selected because of their importance to species distributions but rather because the factor may be correlated with another important variable. Biomapper cannot extract causality relations. Biomapper handles only linear dependencies within a species niche, and the original ecogeographic variables need to be transformed or otherwise manipulated to include non-linear interactions. Another limitation is that some ecogeographic variables may be constant in specialization or in linear combination with other ecogeographic variables. Further, species presence points may therefore not always be unbiased samples of actual distributions (Hirzel et al. 2002).
Given the constraints of data availability and limitations arising from correlated variables and possible biases in data collection, Biomapper is still a powerful tool to construct habitat suitability maps. Factor analysis techniques used in ENFA reduce the necessity of subjective a priori knowledge of species distributions and environmental variables. Hirzel et al. (2002, 2006) report that for a number of habitat-occupancy scenarios, ENFA is more robust than other widely used methods such as logistic regression. ENFA and other species distribution modeling approaches are constantly being modified and improved and are increasingly being adopted in mainstream ecological studies, both to model present scenarios and predict future distributions under anticipated effects from factors such as climate change and habitat loss or fragmentation.
Acknowledgments
The authors would like to thank Greg Newman for his assistance in resolving some of the steps of processing the data. We also would like to thank Paul Evangelista for his encouragement to undertake this project, his knowledge of the Ethiopian antelope species and his extension to us of most of this project’s data.