Introduction
Location Map
Base Map
Database Schema
Conventions
GIS Analyses
Flowchart
GIS Concepts
Results
Conclusion
References
Results
* The results of this project are provisional and not fit for use in any application to the conservation or management of Ethiopian antelope species as modeled using Biomapper. Please do not distribute these materials through any other media (e.g., television, radio, print, electronic) without first contacting the authors (Pranav Chanchani and Ryan McShane).
Number of Factors and Explained Variation of ENFA Models
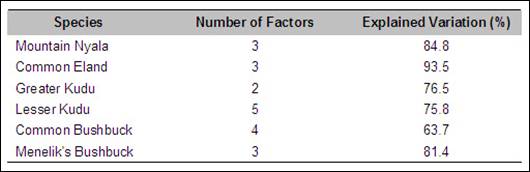
Most of the Ecological Niche Factor Analysis models explained a relatively large amount of the variation in species distributions (from 64% to 94%), with relatively few factors needed to explain the variation (as few as 2 for Greater Kudu but as many as 5 for Lesser Kudu). The number of factors that were important in the models was determined by the broken-stick criterion in Biomapper (see References for Jackson 1993). However, because factor 1 in each model explains the variation in marginality and the other factors explain the variation in specialization, not every model explained the same proportion of marginality versus specialization.
Marginality and Specialization Factors of ENFA Models
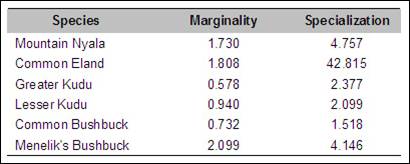
The Ecological Niche Factor Analysis models also generate two scores: marginality and specialization (see References for Hirzel et al. 2002). Marginality scores represent the deviation of the niche space of a species from the space globally available in the study area. Specialization scores represent the breadth of the niche space of a species. A high marginality score means that the habitat conditions of a species are greatly deviating from the habitat conditions globally available in the study area. A high specialization score means that the niche space of a species is quite narrow. Half of the species had relatively high marginality (Mountain Nyala, Common Eland and Menelik’s Bushbuck). Most of the species had relatively low specialization, except for Mountain Nyala, whose specialization was an order of magnitude higher.
Predictive Power of ENFA Models
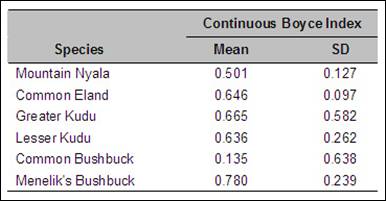
The continuous Boyce Index is computed by a Spearman rank correlation coefficient (see References for Boyce et al. 2002). A high value means that a large amount of the data on locations of each species was correlated to the ecogeographic variable data used as predictor layers in the models. Most of the Ecological Niche Factor Analysis models delivered relatively high predictive power (from 50% to 78%), except for Common Bushbuck, which only supplied 14%. Also, even though the model for Greater Kudu had high predictive power, its variability was high, which diminishes the validity of the model.
Habitat Suitability and ENFA Models of Antelope Species
Tragelaphus
buxtoni (Mountain Nyala)
oryx (Common Eland)
strepsiceros (Greater Kudu)
imberbis (Lesser Kudu)
scriptus (Common Bushbuck)
scriptus meneliki (Menelik’s Bushbuck)
Mountain Nyala (Tragelaphus buxtoni)
Habitat Suitability Map

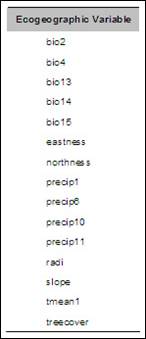
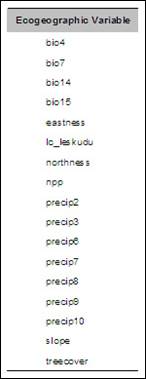
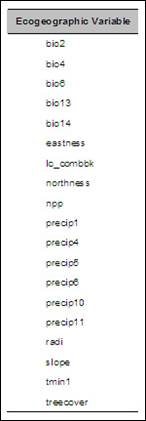
Predictor Layers
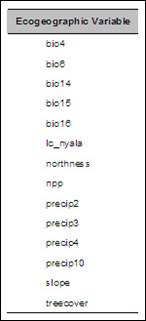
* See Conventions for further information on the names of the ecogeographic variables.
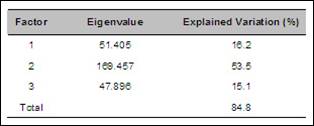
Ecological Niche Factor Analysis
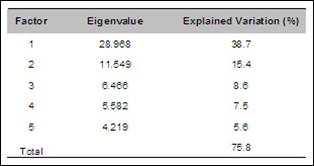
Eigenvalues and explained variation of each important factor
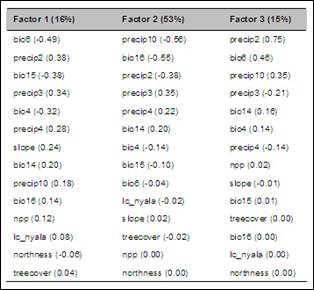
Contribution of each predictor layer to each significant factor
* Percentages are the variation explained by each factor.
** Decimals are the contribution of each predictor layer to each factor, ranked from highest to lowest absolute value; a positive value means that the species prefers the high values of the predictor layer and a negative value means that the species prefers the low values.
Global and Species Marginality Factor Distribution
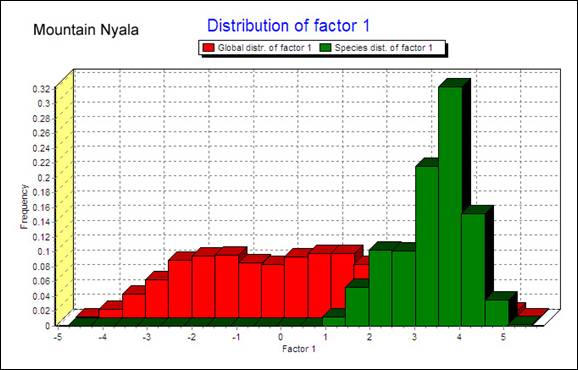
Mountain Nyala suitable habitat deviates moderately from available conditions in Ethiopia.
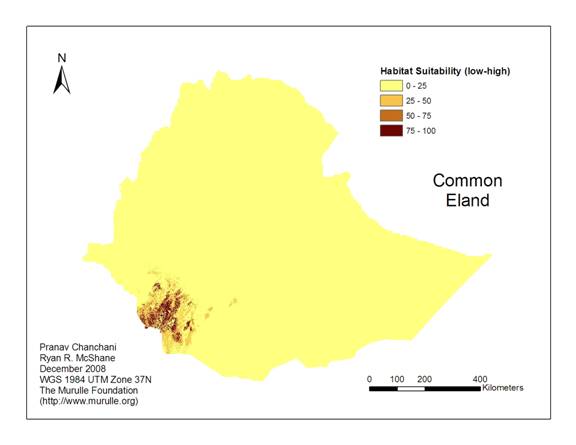
Common Eland (Tragelaphus oryx)
Habitat Suitability Map
Predictor Layers
* See Conventions for further information on the names of the ecogeographic variables.
Ecological Niche Factor Analysis
Eigenvalues and explained variation of each important factor

Contribution of each predictor layer to each significant factor
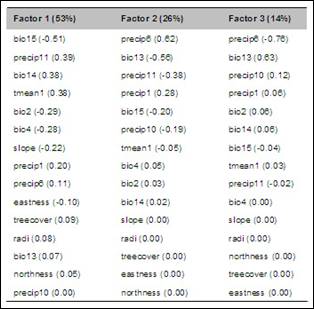
* Percentages are the variation explained by each factor.
** Decimals are the contribution of each predictor layer to each factor, ranked from highest to lowest absolute value; a positive value means that the species prefers the high values of the predictor layer and a negative value means that the species prefers the low values.
Global and Species Marginality Factor Distribution
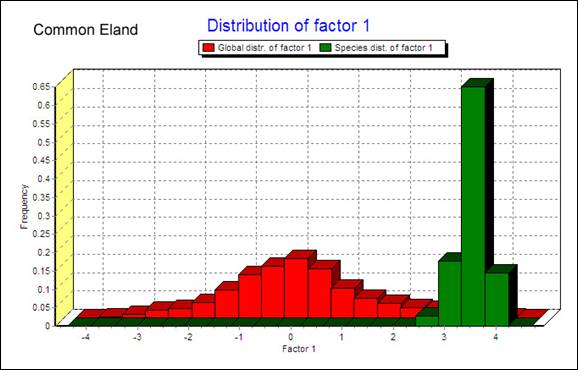
Common Eland suitable habitat deviates extremely from available conditions in Ethiopia.
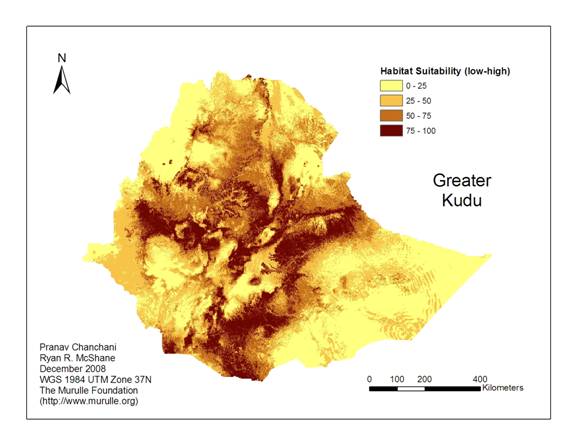
Greater Kudu (Tragelaphus strepsiceros)
Habitat Suitability Map
Predictor Layers
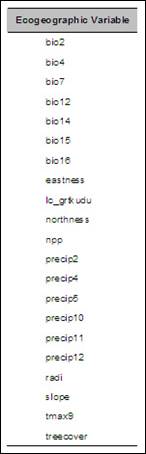
* See Conventions for further information on the names of the ecogeographic variables.
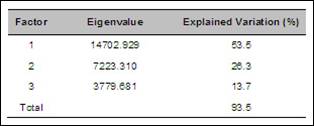
Ecological Niche Factor Analysis
Eigenvalues and explained variation of each important factor
Contribution of each predictor layer to each significant factor
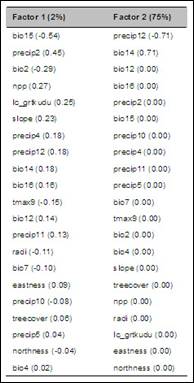
* Percentages are the variation explained by each factor.
** Decimals are the contribution of each predictor layer to each factor, ranked from highest to lowest absolute value; a positive value means that the species prefers the high values of the predictor layer and a negative value means that the species prefers the low values.
Global and Species Marginality Factor Distribution
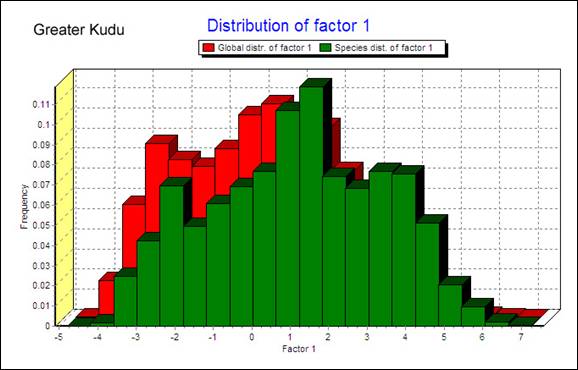
Greater Kudu suitable habitat deviates minimally from available conditions in Ethiopia.
Lesser Kudu (Tragelaphus imberbis)
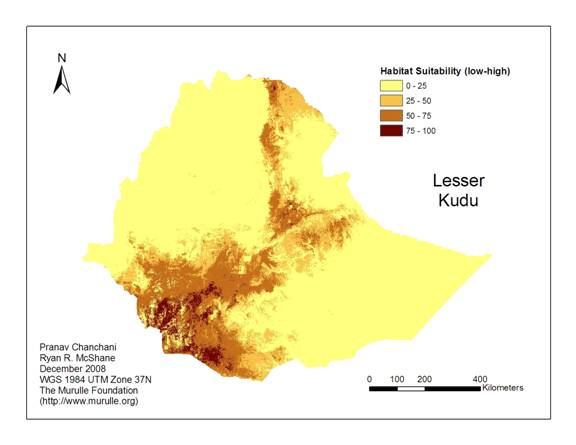
Habitat Suitability Map
Predictor Layers
* See Conventions for further information on the names of the ecogeographic variables.
Ecological Niche Factor Analysis
Eigenvalues and explained variation of each important factor
Contribution of each predictor layer to each significant factor
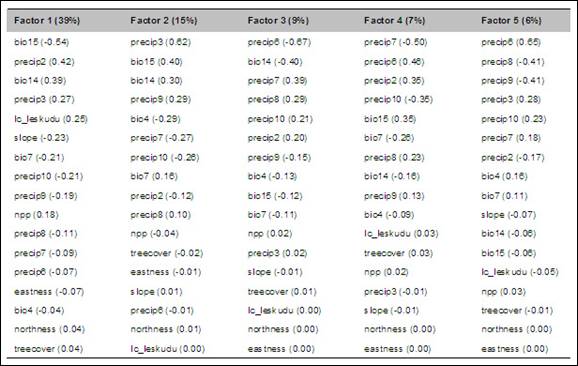
* Percentages are the variation explained by each factor.
** Decimals are the contribution of each predictor layer to each factor, ranked from highest to lowest absolute value; a positive value means that the species prefers the high values of the predictor layer and a negative value means that the species prefers the low values.
Global and Species Marginality Factor Distribution
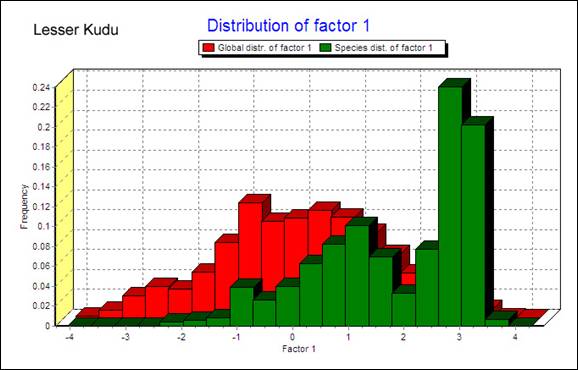
Lesser Kudu suitable habitat deviates moderately from available conditions in Ethiopia.
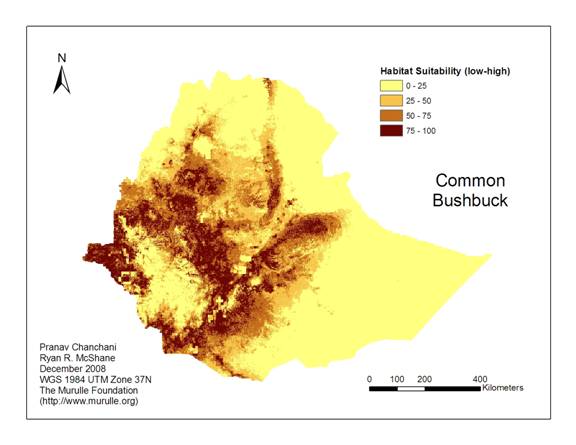
Common Bushbuck (Tragelaphus scriptus)
Habitat Suitability Map
Predictor Layers
* See Conventions for further information on the names of the ecogeographic variables.
Ecological Niche Factor Analysis
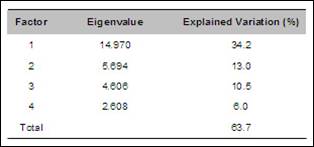
Eigenvalues and explained variation of each important factor
Contribution of each predictor layer to each significant factor
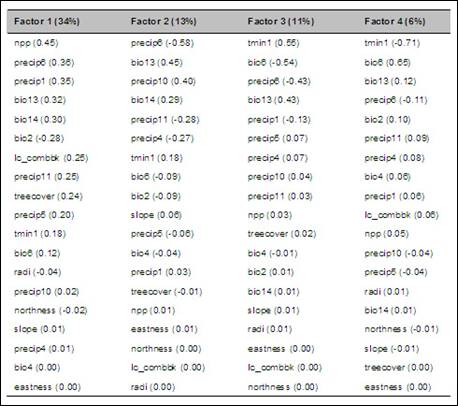
* Percentages are the variation explained by each factor.
** Decimals are the contribution of each predictor layer to each factor, ranked from highest to lowest absolute value; a positive value means that the species prefers the high values of the predictor layer and a negative value means that the species prefers the low values.
Global and Species Marginality Factor Distribution
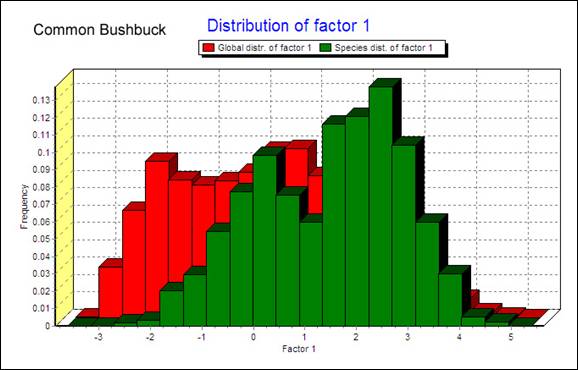
Common Bushbuck suitable habitat deviates moderately from available conditions in Ethiopia.
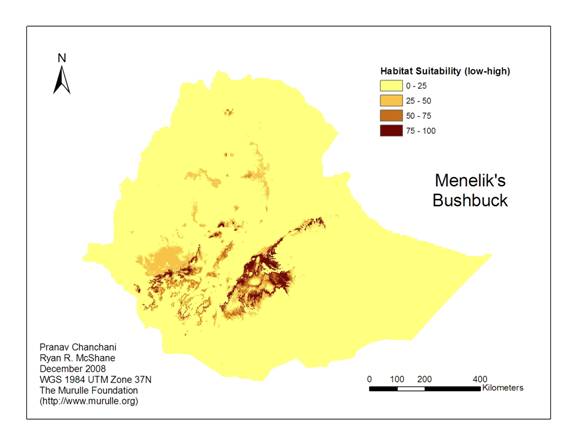
Menelik’s Bushbuck (Tragelaphus scriptus meneliki)
Habitat Suitability Map
Predictor Layers
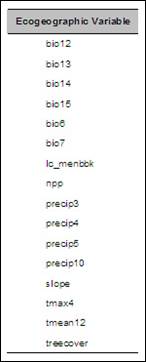
* See Conventions for further information on the names of the ecogeographic variables.
Ecological Niche Factor Analysis
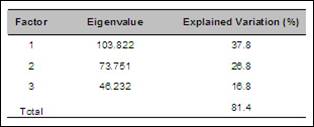
Eigenvalues and explained variation of each important factor
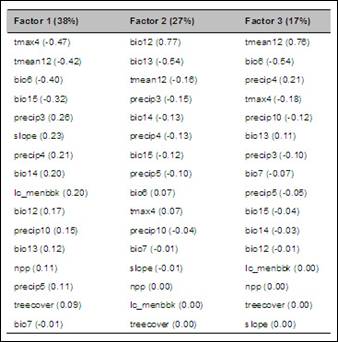
Contribution of each predictor layer to each significant factor
* Percentages are the variation explained by each factor.
** Decimals are the contribution of each predictor layer to each factor, ranked from highest to lowest absolute value; a positive value means that the species prefers the high values of the predictor layer and a negative value means that the species prefers the low values.
Global and Species Marginality Factor Distribution
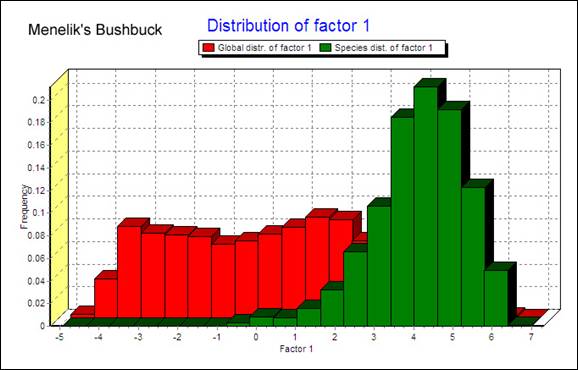
Menelik’s Bushbuck suitable habitat deviates moderately from available conditions in Ethiopia.