Introduction
Location Map
Base Map
Database Schema
Conventions
GIS Analyses
Flowchart
GIS Concepts
Results
Conclusion
References
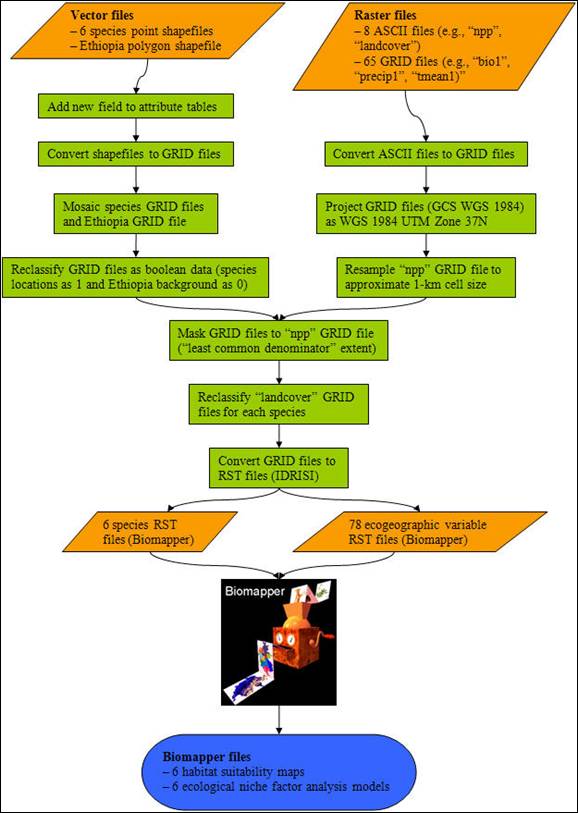
Flowchart
Orange boxes are data files, green boxes are processing and analysis steps, the black box is Biomapper, which is “the” analysis step (Biomapper uses somewhat of a “black box” approach because it is unknown how the algorithms work), and the blue box is the final data files, maps and models.
* See GIS Analyses for further information about the processing and analysis steps.
